

Chinh phục Line Graph bằng Tư duy 3 Giai đoạn
Để chinh phục dạng bài biểu đồ đường (Line Graph) một cách triệt để từ cơ bản đến nâng cao, chúng ta sẽ áp dụng phương pháp luận 3 giai đoạn: Xử lý đầu vào (Input Processing), Triển khai bài viết (Writing Execution), và Phân tích sâu sau bài viết (Post-writing Analysis).
Trong bài giảng này, bạn sẽ tự tay hoàn thiện một bài viết hoàn chỉnh thông qua các bài tập tương tác từ mức dễ (5.5) đến cực khó (8.5+). Hãy điền đáp án trực tiếp vào các ô trống và bấm “Kiểm tra” nhé!
Dàn ý chung chuẩn mực
- Introduction: Paraphrase đề bài.
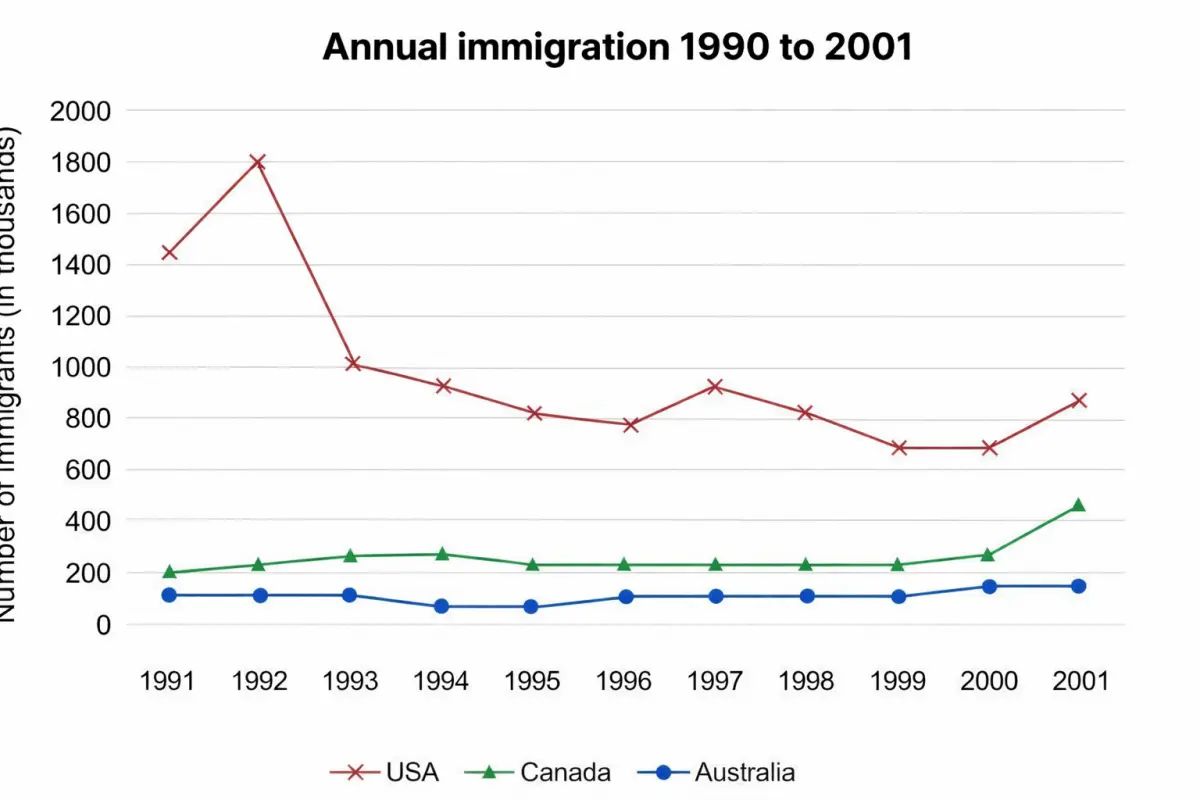
- Overview (Tổng quan): Tìm 2 đặc điểm nổi bật nhất (USA cao và dao động nhất; Canada giảm trong khi Australia ổn định ở mức thấp).
- Body 1 (USA): Báo cáo dữ liệu của Mỹ (Đỉnh 1992 & 1999, đáy 1995).
- Body 2 (Canada & Australia): Gom nhóm so sánh (Canada giảm từ mức >200k, Australia tà tà dưới 100k).
Kỹ năng Đọc & Phân tích Line Graph đa năng
Có từ vựng hay mà không biết phân tích thì bài viết vẫn bị điểm kém. Dưới đây là Công thức 3 bước áp dụng cho MỌI bài Line Graph để tối đa điểm Task Achievement:
Bước 1: Nhìn Tổng Quan (Overview)
Chỉ nhìn Điểm đầu và Điểm cuối của các đường. Xác định: Đường nào cao nhất/thấp nhất? Xu hướng chung là tăng hay giảm?
Bước 2: Gom Nhóm (Grouping – Chia Đoạn)
KHÔNG BAO GIỜ miêu tả từng đường một từ trên xuống dưới. Hãy nhóm các đường thành 2 đoạn Thân bài theo nguyên tắc: Cùng xu hướng (Cùng tăng/cùng giảm) HOẶC Tương phản nhau HOẶC Có độ lớn tương đương nhau.
Bước 3: Bắt Điểm Rơi (Key Data Points)
Giám khảo sẽ trừ điểm nếu bạn liệt kê số liệu của từng năm. Bạn CHỈ được miêu tả các mốc sau: Năm bắt đầu, Năm kết thúc, Đỉnh cao nhất (Peak), Đáy thấp nhất (Nadir), và Điểm giao cắt (Intersection).
📝 Bài tập: Áp dụng phân tích biểu đồ “Immigration”
1. Nhìn Tổng quan: Xuyên suốt từ 1990 đến 2001, đường nào luôn giữ vị trí độc tôn cao nhất và dao động mạnh nhất?
2. Gom nhóm chia Body: Tại sao bài giảng lại khuyên gom Canada và Australia vào chung Đoạn Thân Bài 2?
3. Bắt điểm rơi của Mỹ: Đâu là các năm QUAN TRỌNG NHẤT bắt buộc phải nhắc đến khi tả đường biểu diễn của Mỹ?
Band 5.5: Xử lý Mở bài & Chọn lọc số liệu
Trọng tâm: Báo cáo dữ liệu cơ bản (Input Processing). Ở trình độ này, bạn cần hiểu trục tung/trục hoành và điền đúng số liệu, không sai giới từ (in, to, at, by).
📝 Bài tập 1: Xây dựng Introduction & Overview
The line graph
how many immigrants moved
the USA, Canada, and Australia
1990 and 2001.
Overall, the USA had the
number of immigrants in all years. Also, the number of people going to Canada went down,
the figure for Australia stayed quite stable.
📝 Bài tập 2: Điền Động từ Quá khứ & Giới từ (Body 1 & 2)
Câu 1 (Mỹ): Looking at the USA, the number
over 1 million in 1990. Then, it
a peak of about 1.4 million in 1992. After that, it fell to under 1 million
1995.
Câu 2 (Canada): Immigration to Canada started at about 210,000 and gradually
150,000 in 2001.
Câu 3 (Australia): The figure for Australia
stable
under 100,000
the period.
📝 Bài tập 3: Tư duy Chọn lọc số liệu (Data Selection)
Hãy chọn chiến lược báo cáo số liệu đúng cho các tình huống sau:
1. Miêu tả chi tiết số liệu của TỪNG NĂM (1990, 1991, 1992…)?
2. Có nên báo cáo chi tiết số lượng nhập cư của Mỹ vào năm 1993 không?
3. Có bắt buộc phải so sánh số liệu của 3 nước ở năm đầu tiên (1990) không?
📝 Bài tập 4: Sắp xếp câu (Sentence Unscrambling)
Sắp xếp các từ bị xáo trộn sau để tạo thành một câu miêu tả hoàn chỉnh (chuẩn cấu trúc cơ bản):
“The number of immigrants to the USA increased significantly.”
📚 Bài mẫu Band 5.5 & Luyện Dịch
The line graph shows how many immigrants moved to the USA, Canada, and Australia between 1990 and 2001.
Overall, the USA had the highest number of immigrants in all years. Also, the number of people going to Canada went down, but the figure for Australia stayed quite stable.
Looking at the USA, the number started at over 1 million in 1990. Then, it went up to a peak of about 1.4 million in 1992. After that, it fell to under 1 million in 1995, before rising again to around 1.3 million in 1999.
For Canada, immigration started at about 210,000 in 1990. It fell continuously to about 150,000 in 2001. In contrast, Australia had the lowest number. It started at around 80,000, went up a little in 1992, and then stayed at about 80,000 until 2001.
1. Biểu đồ đường cho thấy có bao nhiêu người nhập cư đã chuyển đến Mỹ, Canada và Úc từ năm 1990 đến 2001.
2. Nhìn chung, Mỹ có số lượng người nhập cư cao nhất trong tất cả các năm.
3. Ngoài ra, số người đến Canada đã giảm xuống, nhưng con số của Úc vẫn khá ổn định.
4. Nhìn vào Mỹ, con số bắt đầu ở mức hơn 1 triệu vào năm 1990.
5. Sau đó, nó tăng lên mức đỉnh khoảng 1,4 triệu vào năm 1992.
6. Sau đó, nó giảm xuống dưới 1 triệu vào năm 1995, trước khi tăng trở lại khoảng 1,3 triệu vào năm 1999.
7. Đối với Canada, lượng người nhập cư bắt đầu ở khoảng 210.000 vào năm 1990.
8. Nó giảm liên tục xuống còn khoảng 150.000 vào năm 2001.
9. Ngược lại, Úc có con số thấp nhất.
10. Nó bắt đầu ở mức khoảng 80.000, tăng một chút vào năm 1992, và sau đó giữ ở mức khoảng 80.000 cho đến năm 2001.
Band 6.0 – 6.5: Triển khai Cấu trúc ngữ pháp
Trọng tâm: Gom nhóm thông tương phản (Writing Execution) và đặc biệt phải biết chuyển đổi linh hoạt giữa cấu trúc Verb + Adverb sang Adjective + Noun. Đồng thời phải biết Ước lượng số liệu (Approximation).
📝 Bài tập 1: Nối câu thể hiện sự đối lập (Body 2)
Câu 1:
Canada saw a gradual decrease in its immigrant numbers to roughly 150,000, Australia’s figures remained stable at under 100,000
the 11-year period.
Câu 2: The USA experienced massive fluctuations,
Australia witnessed a stable trend,
highlights a stark contrast between the two nations.
📝 Bài tập 2: Sửa lỗi sai phân tích biểu đồ (Error Correction)
Đóng vai giám khảo, gõ lại từ ĐÚNG thay thế cho từ sai trong ngoặc kép:
Câu 1: “In 1990, Canada received about 210,000 immigrants. After that, this figure [increased]
continuously to roughly 150,000 in 2001, [similarly to]
Australia’s trend, which stayed stable.”
Câu 2: “The number of immigrants to the USA started at just over 1 million and then experienced a [steady rise]
to its peak in 1992.”
Câu 3: “Australia reached a [peak]
of 80,000 in 2001.” (Gợi ý: Úc đi ngang chứ không có đỉnh)
📝 Bài tập 3: Chuyển đổi Cấu trúc (Verb+Adv ➜ Adj+Noun)
Hãy biến đổi các câu sau để ghi điểm ngữ pháp đa dạng cho Band 6.5:
2. (Verb+Adv): Canada decreased gradually. ➜ (Adj+Noun): Canada saw a .
3. (Verb+Adv): Australia remained stable. ➜ (Adj+Noun): Australia experienced a .
📝 Bài tập 4: Kỹ năng Ước lượng số liệu (Approximation)
Giám khảo sẽ trừ điểm nặng nếu bạn ghi số liệu tuyệt đối khi đường kẻ nằm lơ lửng. Hãy chọn cụm từ ước lượng phù hợp:
1. Năm 1990, số lượng nhập cư vào Mỹ nằm nhích qua vạch 1 million một xíu. Ta nên viết: The number started at
1 million.
2. Năm 1999, điểm chạm của Mỹ nằm khoảng giữa 1.2 và 1.4 million. Ta nên viết: The figure rebounded to
1.3 million.
3. Xuyên suốt các năm, đường của Úc luôn nằm lơ lửng dưới đường mốc 100,000. Ta nên viết: Australia’s figures remained stable at
100,000.
📚 Bài mẫu Band 6.5 & Luyện Dịch
The line graph illustrates the immigration patterns to three different countries: the USA, Canada, and Australia from 1990 to 2001.
Overall, it is clear that the USA received the highest number of immigrants throughout the period, despite significant fluctuations. Meanwhile, immigration to Canada experienced a downward trend, whereas the figure for Australia remained relatively stable.
Regarding the USA, the number of immigrants was over 1 million in 1990, which was significantly higher than the other two nations. This figure fluctuated wildly, reaching a peak of approximately 1.4 million in 1992, dropping below 1 million in 1995, and recovering to around 1.3 million by 1999.
In terms of Canada and Australia, Canada started with about 210,000 immigrants in 1990. While Canada saw a gradual decrease in its immigrant numbers to finish at roughly 150,000 in 2001, Australia’s figures remained stable at under 100,000 throughout the 11-year period.
1. Biểu đồ đường minh họa mô hình nhập cư vào ba quốc gia khác nhau: Mỹ, Canada và Úc từ năm 1990 đến 2001.
2. Nhìn chung, rõ ràng là Mỹ đã nhận được lượng người nhập cư cao nhất trong suốt thời kỳ này, mặc dù có những biến động đáng kể.
3. Trong khi đó, nhập cư vào Canada trải qua một xu hướng giảm, trong khi con số của Úc vẫn tương đối ổn định.
4. Về phần Mỹ, số lượng người nhập cư là hơn 1 triệu vào năm 1990, cao hơn đáng kể so với hai quốc gia còn lại.
5. Con số này dao động dữ dội, đạt đỉnh khoảng 1,4 triệu vào năm 1992, giảm xuống dưới 1 triệu vào năm 1995, và phục hồi lên khoảng 1,3 triệu vào năm 1999.
6. Về phía Canada và Úc, Canada bắt đầu với khoảng 210.000 người nhập cư vào năm 1990.
7. Trong khi Canada chứng kiến sự sụt giảm dần dần về số lượng người nhập cư để kết thúc ở mức xấp xỉ 150.000 vào năm 2001, thì số liệu của Úc vẫn ổn định ở mức dưới 100.000 trong suốt thời kỳ 11 năm.
Band 7.0 – 7.5: Ngôn ngữ So sánh & Đa dạng hóa Thời gian
Trọng tâm: Line Graph không chỉ là biểu đồ xu hướng mà còn thể hiện khoảng cách giữa các đường. Hơn nữa, việc lặp đi lặp lại “in 1990”, “in 1995” sẽ khiến bạn kẹt ở Band 6.0. Bạn phải biết đa dạng hóa Cụm từ thời gian (Time-phrase Variation).
📝 Bài tập 1: Nâng cấp Đoạn văn (Lexical Upgrade)
Đoạn 1 (USA): This figure was characterized by [a lot of up and downs]
, surging to a high of roughly 1.4 million in 1992, before [going down very fast]
to a low of nearly 800,000 in 1995.
Đoạn 2 (Canada & Aus): Over the following years, there was a [slow drop]
in Canadian immigration. Conversely, Australia experienced only [small changes]
throughout the entire timeframe.
📝 Bài tập 2: So sánh tương quan (Proportional Comparison)
Hãy vận dụng tư duy toán học cơ bản để miêu tả khoảng cách giữa các đường:
Câu 1 (So sánh Canada và Úc năm 1990): Canada initially welcomed approximately 210,000 people, which was almost
the Australian figure of 80,000.
Câu 2 (So sánh Mỹ và phần còn lại): Overall, the USA was
higher than the other two nations in all years.
Câu 3 (So sánh Mỹ và Canada đỉnh điểm 1992): In 1992, the US peak of 1.4 million was roughly
higher than Canada’s figure (around 200,000).
📝 Bài tập 3: Đa dạng hóa Cụm từ Thời gian (Time-phrase Variation)
Đừng viết “in 1995” hay “in 2001” liên tục. Hãy thay bằng các cụm từ Band 7.5+ dưới đây:
1. Thay vì viết “In 1990”, ta có thể viết: “At the
, Canada welcomed 210,000 immigrants.”
2. Để nối sang diễn biến những năm kế tiếp (từ 1990 đến 2001), thay vì lặp “from 1990 to 2001″, hãy dùng cụm: ”
, there was a steady drop in Canadian immigration.”
3. Để chốt lại số liệu năm cuối (2001), thay vì viết “In 2001, it was…”, hãy dùng cụm: “…, ending the period at roughly 150,000
.”
📝 Bài tập 4: Paraphrasing (Viết lại cấu trúc ngữ pháp)
Hãy viết lại câu Mở bài (Introduction) bằng 2 cấu trúc ngữ pháp đa dạng (Mệnh đề danh từ hoặc Cấu trúc chủ ngữ giả).
“The provided line graph illustrates how many people immigrated to three different nations between 1990 and 2001.”
Cách 2 (Dùng chủ ngữ giả & Mệnh đề quan hệ):
“It is clear from the graph the number of people who migrated to the USA, Canada, and Australia over an 11-year period.”
📚 Bài mẫu Band 7.5 & Luyện Dịch
The provided line graph compares the influx of immigrants into the USA, Canada, and Australia over an 11-year period starting from 1990.
Overall, what stands out from the graph is that the USA was consistently the most popular destination, albeit with highly erratic figures. In contrast, while Canadian immigration witnessed a steady decline, the influx into Australia remained consistently low and stable.
Looking closely at the USA, the period commenced with just over a million immigrants. This figure was characterized by wild fluctuations, surging to a high of roughly 1.4 million in 1992, before plummeting to a low of nearly 800,000 in 1995. Subsequently, the country saw another significant spike, climbing back to 1.3 million by 1999.
Turning to the remaining two nations, Canada initially welcomed approximately 210,000 people. Over the following years, there was a steady drop in Canadian immigration, ending the period at roughly 150,000. Conversely, Australia experienced only marginal changes, maintaining an influx of just under 100,000 people throughout the entire timeframe.
1. Biểu đồ đường được cung cấp so sánh dòng người nhập cư vào Mỹ, Canada và Úc trong khoảng thời gian 11 năm bắt đầu từ năm 1990.
2. Nhìn chung, điểm nổi bật từ biểu đồ là Mỹ luôn là điểm đến phổ biến nhất, mặc dù với các số liệu có tính dao động cao.
3. Ngược lại, trong khi nhập cư ở Canada chứng kiến sự sụt giảm đều đặn, thì dòng người đổ về Úc luôn duy trì ở mức thấp và ổn định.
4. Nhìn kỹ vào Mỹ, thời kỳ này bắt đầu với hơn một triệu người nhập cư một chút.
5. Con số này được đặc trưng bởi những biến động dữ dội, tăng vọt lên mức cao khoảng 1,4 triệu vào năm 1992, trước khi lao dốc xuống mức thấp gần 800.000 vào năm 1995.
6. Sau đó, quốc gia này chứng kiến một đợt tăng đột biến đáng kể khác, leo trở lại mức 1,3 triệu vào năm 1999.
7. Chuyển sang hai quốc gia còn lại, ban đầu Canada chào đón khoảng 210.000 người.
8. Trong những năm tiếp theo, có sự sụt giảm đều đặn trong lượng người nhập cư vào Canada, kết thúc thời kỳ ở mức khoảng 150.000.
9. Ngược lại, Úc chỉ trải qua những thay đổi không đáng kể, duy trì dòng người nhập cư ở mức ngay dưới 100.000 người trong suốt toàn bộ khung thời gian.
Band 8.0 – 8.5: Đa dạng Chủ ngữ & Nén thông tin
Trọng tâm: Tránh lặp lại chủ ngữ “The number of…”. Kết hợp kỹ thuật Danh từ hóa (Nominalization) (Post-writing Analysis) để câu siêu đặc thông tin, mang đậm tính học thuật.
📝 Bài tập 1: Đa dạng hóa Chủ ngữ (Subject Variation)
Làm thế nào để tránh lặp chủ ngữ “Immigration to Canada / The number of immigrants”?
“Canadian immigration embarked on a progressive decline.”
Cách 2 (Lấy thời gian làm chủ ngữ):
“The period witnessed a progressive decline in Canadian immigration.”
Cách 3 (Lấy xu hướng làm chủ ngữ giả):
“A progressive decline was observed in Canadian immigration figures.”
📝 Bài tập 2: Viết lại câu nén thông tin liên hoàn
Hãy gộp 3 câu văn gốc (Band 6.0) lủng củng dưới đây thành 1 câu duy nhất (Band 8.5) bằng cách ghép nối chuỗi động từ mạnh.
Câu gốc 2: Then it fell heavily to 800,000 in 1995.
Câu gốc 3: Then it went up again to 1.3 million in 1999.
“Specifically, the US figure peaked dramatically at 1.4 million in 1992, experienced a stark plunge to a nadir of 800,000 in 1995, and subsequently rebounded to 1.3 million by 1999.”
Phân tích: Ở trình độ 8.0+, người bản xứ sẽ không tách ra 3 câu, mà đặt 1 chủ ngữ chung (the US figure) và liệt kê một chuỗi hành động đi kèm trạng ngữ.
📝 Bài tập 3: Viết lại bài mẫu (Rewriting for optimization)
Đoạn văn dưới đây đạt Band 6.5-7.0 nhưng còn khá dài dòng và nhiều từ thừa (filler words). Hãy đóng vai giám khảo, cắt gọt những từ thừa thãi để luồng thông tin (flow) trở nên tự nhiên và sắc sảo hơn.
“The USA remained the predominant destination for immigrants by a wide margin throughout the period.”
Phân tích: Bài 8.5 loại bỏ hoàn toàn các cụm từ thừa không mang lại giá trị báo cáo dữ liệu, thay vào đó đi thẳng vào trọng tâm bằng danh từ/tính từ cực mạnh (“predominant destination”, “by a wide margin”).
Band 8.5+: Siêu cao cấp & Bài Mẫu
Để bài viết mượt mà như một dòng chảy và đạt điểm tối đa ở tiêu chí CC (Coherence & Cohesion) và LR (Lexical Resource), bạn cần làm chủ 4 kỹ năng sau:
📝 Kỹ năng 1: Liên kết “Vô hình” (Seamless Cohesion)
Giám khảo 8.5+ không thích bạn lạm dụng “However” hay “Moreover”. Hãy dùng đại từ chỉ thị (This/Such) kết hợp danh từ tóm tắt câu trước để tạo sự móc xích.
Câu 1: The US figure peaked dramatically at 1.4 million in 1992.
Câu 2:
significantly widened the gap between the USA and the other nations.
Câu 3: The USA experienced highly volatile figures.
Câu 4:
was not seen in Canada, where figures steadily dwindled.
📝 Kỹ năng 2: Độ chính xác Collocations (Lexical Precision)
Hãy gõ chính xác các Collocation bản xứ để thay thế cho những từ “bình dân”:
1. Thay vì “dropped to the lowest point”, dùng: experienced a stark
to a
.
2. Thay vì “went up again”, dùng: subsequently
.
📝 Kỹ năng 3: Tương quan Vĩ mô (Macro-synthesis)
Đừng chỉ tả biểu đồ tăng/giảm. Hãy tả sự lấn át, khoảng cách chênh lệch giữa các đường.
1. The USA dominated the chart,
the figures of Canada and Australia.
2. This surge significantly
the
between the USA and the other nations.
📝 Kỹ năng 4: “Nhào lộn” Cú pháp (Syntactic Gymnastics)
Dùng Mệnh đề phân từ (V-ing đứng đầu câu) để rút gọn và nối câu chuyên nghiệp.
“Starting at a modest 80,000, the Australian figure maintained a remarkably flat trend throughout the period.”
📚 Bài mẫu Band 8.5+ & Luyện Dịch
The line graph delineates the annual immigration figures for the USA, Canada, and Australia between 1990 and 2001.
Overall, the USA remained the predominant destination for immigrants by a wide margin, despite its highly volatile trajectory. Furthermore, a diverging trend was observed between the other two nations, with Canadian figures steadily dwindling against Australia’s static, low-level influx.
Examining the dominant US trajectory, an initial figure of just over 1 million in 1990 was followed by erratic shifts. Specifically, it peaked dramatically at 1.4 million in 1992, experienced a stark plunge to a nadir of approximately 800,000 in 1995, and subsequently rebounded to 1.3 million by 1999 before concluding the period with a slight drop.
Comparatively, Canadian and Australian immigration levels were vastly lower. Canada’s initial intake of roughly 210,000—almost triple Australia’s 80,000—embarked on a progressive decade-long decline, finalizing at roughly 150,000. Meanwhile, Australia maintained a notably flat trend, hovering consistently below the 100,000 mark throughout the entire span.
1. Biểu đồ đường phác họa các số liệu nhập cư hàng năm của Mỹ, Canada và Úc từ năm 1990 đến 2001.
2. Nhìn chung, Mỹ vẫn là điểm đến chiếm ưu thế đối với người nhập cư với một khoảng cách lớn, bất chấp quỹ đạo đầy biến động của nó.
3. Hơn nữa, một xu hướng phân kỳ đã được quan sát thấy giữa hai quốc gia còn lại, với các số liệu của Canada ngày càng thu hẹp so với dòng chảy ổn định ở mức thấp của Úc.
4. Xem xét quỹ đạo thống trị của Mỹ, con số ban đầu chỉ hơn 1 triệu vào năm 1990 đã được theo sau bởi những thay đổi thất thường.
5. Cụ thể, số liệu của Mỹ đạt đỉnh một cách ngoạn mục ở mức 1,4 triệu vào năm 1992, trải qua một cú lao dốc rõ rệt xuống điểm đáy khoảng 800.000 vào năm 1995, và sau đó phục hồi lên 1,3 triệu vào năm 1999 trước khi kết thúc thời kỳ với một sự sụt giảm nhẹ.
6. Tương quan mà nói, mức độ nhập cư của Canada và Úc thấp hơn rất nhiều.
7. Lượng tiếp nhận ban đầu của Canada khoảng 210.000 người – gần gấp ba lần con số 80.000 của Úc – đã bước vào một sự suy giảm lũy tiến kéo dài cả thập kỷ, chốt lại ở mức xấp xỉ 150.000.
8. Trong khi đó, Úc duy trì một xu hướng đi ngang đáng chú ý, luôn dao động ở mức dưới mốc 100.000 trong suốt toàn bộ chu kỳ.
Tổng hợp: Phân tích sự tiến hóa của câu
1. Phân tích câu Overview (Miêu tả Mỹ)
-
Band 5.5: The USA had the highest number of immigrants in all years.
➤ (Input Processing) Đúng ngữ pháp cơ bản, nhưng từ vựng lặp và cấu trúc đơn điệu. -
Band 6.5: The USA received the highest number of immigrants throughout the period, despite significant fluctuations.
➤ (Writing Execution) Bổ sung mệnh đề nhượng bộ “despite significant fluctuations” để bao quát luôn cả xu hướng động. -
Band 7.5: The USA was consistently the most popular destination, albeit with highly erratic figures.
➤ (Lexical Upgrade) Nâng cấp từ vựng học thuật: “highest number” -> “most popular destination”, “despite” -> “albeit with”, “fluctuations” -> “erratic figures”. -
Band 8.5+: The USA remained the predominant destination for immigrants by a wide margin, despite its highly volatile trajectory.
➤ (Post-writing Analysis) Dùng danh từ nén “highly volatile trajectory”. Thêm tương quan vĩ mô “by a wide margin” (bỏ xa phần còn lại).
2. Phân tích câu Body (So sánh Canada & Úc)
- Band 5.5: For Canada, immigration started at about 210,000 in 1990. It fell continuously to about 150,000 in 2001. In contrast, Australia stayed at about 80,000.
-
Band 6.5: While Canada saw a gradual decrease in its immigrant numbers to roughly 150,000, Australia’s figures remained stable at under 100,000.
➤ (Writing Execution) Gom 2 nước vào 1 câu phức dùng “While” để tạo sự so sánh tương phản rõ nét. -
Band 7.5: While Canadian immigration witnessed a steady decline, the influx into Australia remained consistently low and stable.
➤ (Lexical Upgrade) Thay đổi chủ ngữ linh hoạt: “Canadian immigration”, dùng từ vựng xịn “witnessed a steady decline”, “influx into”. -
Band 8.5+: Canada’s initial intake of roughly 210,000 embarked on a progressive decade-long decline… Meanwhile, Australia maintained a notably flat trend.
➤ (Nominalization & Collocation) “started at” biến thành “initial intake”. “saw a decrease” nén thành collocation “embarked on a progressive decade-long decline”.
Đề thi (Bản cũ): Immigration to 3 countries (1990 – 2001)
Chinh phục Đề thi: Production of Forest Industry
Biểu đồ này (1980-2000) mang đến một thử thách thú vị: Sự xuất hiện của Điểm giao cắt (Intersection). Việc nhận diện và miêu tả được điểm giao cắt này là “chìa khóa vàng” để giám khảo chấm bạn từ Band 6.5 trở lên.
Đơn vị ở đây là Million Tonnes (Triệu tấn), hãy cẩn thận để không bị nhầm lẫn khi báo cáo số liệu!
Dàn ý chiến lược
- Overview: Paper & Packaging luôn dẫn đầu và là sản phẩm duy nhất có xu hướng tăng rõ rệt. Hai sản phẩm còn lại có sản lượng thấp hơn và chứng kiến sự thu hẹp/hoán đổi vị trí.
- Body 1 (Paper & Packaging): Báo cáo đường cao nhất: Bắt đầu từ khoảng 230, tăng nhẹ đến 1990 (250) rồi bứt tốc mạnh mẽ lên 350 vào năm 2000.
- Body 2 (Sawn-Wood & Wood Pulp): Gom nhóm 2 đường thấp. Điểm nhấn: Năm 1980 Sawn-wood cao hơn, nhưng vì nó giảm đều đặn nên đến khoảng năm 1990, Wood pulp (có xu hướng ổn định) đã vượt mặt Sawn-wood.
Kỹ năng Bắt Điểm Rơi & Giao Cắt
📝 Bài tập: Phân tích số liệu biểu đồ Lâm nghiệp
1. Lỗi sai chết người về đơn vị: Đâu là cách viết đúng nếu bạn muốn nói lượng Paper & Packaging đạt 350 vào năm 2000?
2. Hiện tượng giao cắt: Vào năm 1980, Sawn-wood ở mức 200, cao hơn Wood pulp (~170). Chuyện gì đã xảy ra vào năm 1990 và sau đó?
3. Đọc số liệu Paper & Packaging năm 1980: Đường màu xanh lá đậm bắt đầu ở khoảng bao nhiêu?
Band 5.5: Miêu tả Xu hướng Cơ bản
Trọng tâm: Viết đúng số liệu, không quên cụm “million tonnes” và sử dụng đúng các từ vựng chỉ sự tăng giảm cơ bản.
📝 Bài tập: Điền động từ & số liệu
Câu 1 (Paper): The production of Paper and Packaging started at about
million tonnes. Then, it went up to 250 million tonnes in 1990 before increasing heavily to exactly
million tonnes in 2000.
Câu 2 (Sawn-wood): The figure for Sawn-wood was exactly
million tonnes in 1980. After that, it
continuously to roughly 130 million tonnes at the end of the period.
Câu 3 (Wood pulp): Production of Wood pulp stayed quite
.
It was around 170 million tonnes in 1980 and ended at around 160 million tonnes in 2000.
📚 Bài mẫu Band 5.5 & Luyện Dịch
The line graph shows the production of three forest industry products in the UK from 1980 to 2000.
Overall, the production of Paper and Packaging was the highest and went up. However, the amount of Sawn-wood went down, while Wood pulp stayed quite stable.
Looking at Paper and Packaging, the number started at about 230 million tonnes in 1980. It rose a little to 250 million tonnes in 1990. After that, it increased quickly to reach exactly 350 million tonnes in 2000.
For the other two products, Sawn-wood production began at 200 million tonnes in 1980. It fell continuously to about 130 million tonnes in 2000. On the other hand, Wood pulp started lower at roughly 170 million tonnes. It went down a little and then went up slightly to around 160 million tonnes. Because Sawn-wood fell, Wood pulp became higher than Sawn-wood after 1990.
1. Nhìn chung, sản lượng Giấy và Bao bì là cao nhất và đã đi lên.
2. Nhìn vào Giấy và Bao bì, con số bắt đầu ở khoảng 230 triệu tấn vào năm 1980.
3. Bởi vì Gỗ xẻ giảm, Bột gỗ đã trở nên cao hơn Gỗ xẻ sau năm 1990.
Band 6.0 – 6.5: Cấu trúc Tương phản & Chuyển đổi
📝 Bài tập: Chuyển đổi Cấu trúc (Verb+Adv ➜ Adj+Noun)
Thay vì viết “increased heavily”, hãy dùng cụm danh từ để ghi điểm ngữ pháp:
➜ (Adj+Noun): There was a in paper production between 1990 and 2000.
2. (Verb+Adv): Sawn-wood decreased gradually over the 20 years.
➜ (Adj+Noun): Sawn-wood experienced a over the 20 years.
📚 Bài mẫu Band 6.5 & Luyện Dịch
The line graph illustrates the amount of paper and packaging, wood pulp, and sawn-wood produced in the UK between 1980 and 2000.
Overall, it is clear that paper and packaging was the most heavily produced item, experiencing a significant upward trend. Meanwhile, sawn-wood saw a gradual decline, whereas wood pulp production remained relatively stable.
Regarding paper and packaging, production stood at roughly 230 million tonnes in 1980. This figure rose slightly to 250 million tonnes in 1990, before experiencing a sharp increase to reach a peak of exactly 350 million tonnes by the end of the period.
In terms of the other two categories, sawn-wood started higher at 200 million tonnes compared to wood pulp at about 170 million tonnes in 1980. However, while sawn-wood underwent a continuous decrease to finish at roughly 130 million tonnes, wood pulp fluctuated slightly but remained relatively stable at around 160 million tonnes. Consequently, wood pulp production surpassed sawn-wood after 1990.
Band 7.0 – 7.5: Miêu tả Giao cắt & Biến thiên thời gian
Band 7.5 yêu cầu bạn miêu tả sự vượt lên (surpass/overtake) một cách mượt mà và không lặp lại “in 1980”, “in 2000”.
📝 Bài tập: Từ vựng Giao cắt & Cụm thời gian
Câu 1 (Giao cắt): Because sawn-wood fell continuously, wood pulp successfully
it around 1990 and maintained the lead.
Câu 2 (Cụm thời gian):
, paper and packaging stood at roughly 230 million tonnes. It then surged to 350 million
.
📚 Bài mẫu Band 7.5 & Luyện Dịch
The provided line graph compares the production volumes of paper and packaging, wood pulp, and sawn-wood in the UK over a 20-year period starting from 1980.
Overall, what stands out from the graph is that paper and packaging consistently dominated the forest industry, exhibiting a pronounced upward trend. Conversely, while sawn-wood experienced a steady decline, wood pulp production demonstrated a static trajectory, eventually overtaking sawn-wood.
Looking closely at paper and packaging, the period commenced with a production volume of approximately 230 million tonnes. This figure grew moderately to 250 million tonnes over the first decade. Subsequently, the industry saw a remarkable surge, climbing sharply to culminate at a peak of exactly 350 million tonnes by the end of the timeframe.
Turning to the remaining sectors, sawn-wood initially registered a higher volume than wood pulp, at 200 million and roughly 170 million tonnes respectively. Over the ensuing years, sawn-wood production shrank continuously, dropping to approximately 130 million tonnes by 2000. Meanwhile, wood pulp remained relatively stagnant, hovering around the 160 million tonnes mark. As a direct result of sawn-wood’s decline, wood pulp successfully surpassed it around 1990 and maintained a higher volume thereafter.
Band 8.0 – 8.5: Collocations & Nén thông tin
📝 Bài tập: Điền Collocations Học thuật
1. Để miêu tả việc Paper & Packaging bỏ xa các sản phẩm khác: Paper and packaging dominated the sector, significantly
the gap with the other two categories.
2. Thay vì “went down constantly”: Sawn-wood embarked on a
downward trajectory.
Band 8.5+: Siêu cao cấp & Bài Mẫu
📚 Bài mẫu Band 8.5+ Tuyệt đối
The line graph delineates the production volumes of three key forest industry sectors—paper and packaging, wood pulp, and sawn-wood—in the UK between 1980 and 2000.
Overall, paper and packaging remained the overwhelmingly dominant sector, characterized by a substantial long-term expansion that significantly widened its lead. Furthermore, a diverging trend was observed between the secondary products, wherein a steady contraction in sawn-wood allowed the static wood pulp sector to eventually overtake it.
Examining the preeminent sector, paper and packaging commenced the period at roughly 230 million tonnes. Following a decade of modest growth to 250 million tonnes, production embarked on a remarkable upward trajectory, surging to a formidable peak of precisely 350 million tonnes by the turn of the century.
Conversely, the other two categories yielded vastly lower outputs and exhibited contrasting dynamics. Sawn-wood initially led the pair at exactly 200 million tonnes but subsequently underwent a continuous, twenty-year decline, finalizing at a nadir of approximately 130 million tonnes. Concurrently, wood pulp production maintained a notably flat trend, hovering marginally below its initial 170-million-tonne mark. Crucially, this static performance was sufficient for wood pulp to eclipse the dwindling sawn-wood figures around 1990, maintaining a modest superiority for the remainder of the timeframe.
Đề thi: Production of Forest Industry in the UK